
Shiller's Sobriety
Irrational Exuberance (2015)

TOP-LEVEL
Risk Perception During Bubbles:
In 2004, only 19% believed there was "little or no risk" of home prices falling.
In 2009, during a severe recession, this belief dropped to 17.2%.
Psychological Nature of Bubbles:
Bubbles stem from public inattention to falling prices, not firm beliefs in price stability.
"New era" stories justify actions rather than being strongly held convictions.
Challenges in Controlling Bubbles:
Bubbles are subtle social-psychological phenomena, making them difficult to regulate.
Regulatory actions post-financial crisis may reduce future bubbles, but effectiveness is uncertain.
Market Limitations:
Lack of liquid markets for short-selling homes limits skeptics' influence on prices.
Efficient market theory is undermined without short-sale options.
Investor Influence:
Large groups or institutions can drive prices up without short-selling constraints.
High-tech institutional investors like Blackstone may alter bubble dynamics.
Nature of Speculative Bubbles:
Bubbles can deflate and reflate, rather than popping suddenly as the term suggests.
…
STOCKS, HISTORICALLY
Irrational Exuberance
Psychological basis of a speculative bubble, a situation in which news of price increases causes enthusiasm, which spreads from person to person, and, in the process, amplifies stories that might justify the price increase.
This draws in a larger and larger class of investors, who, despite doubts about the real value of the investment, are drawn to it partly through envy of others’ successes and partly through a gambler’s excitement.
The Millennium Boom
The Millennium Boom (1982–2000) saw a 7.7-fold increase, surpassing previous booms like the 1920s (5.2-fold) and 1949–1968 (5.1-fold).
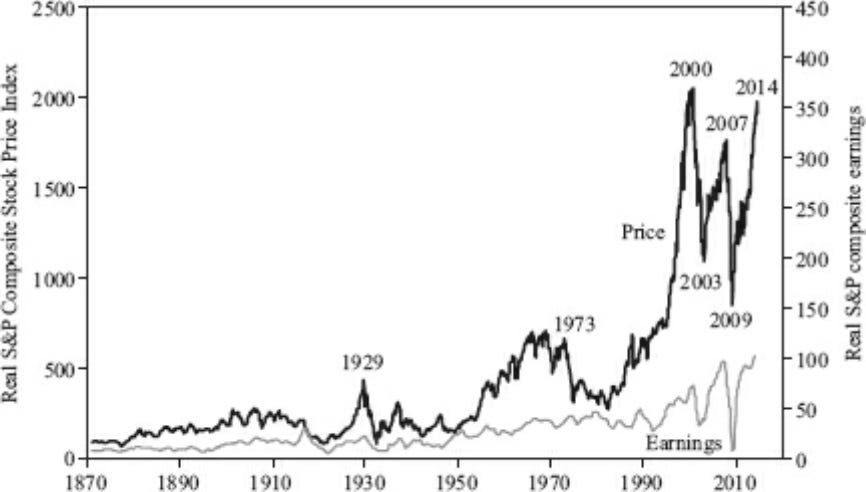
This was irrational exuberance (at least in part) because from 1994 to 2000, stock prices surged without proportional economic growth (GDP rose <40%, corporate profits <60%).
S&P Composite earnings grew rapidly in the late 1990s, more than doubling from 1992 to 1997, but this was partly a recovery from a recession.
Historically, rapid earnings growth has often followed economic depressions, as seen post-1920s, 1930s, and WWII.
CAPE Ratio
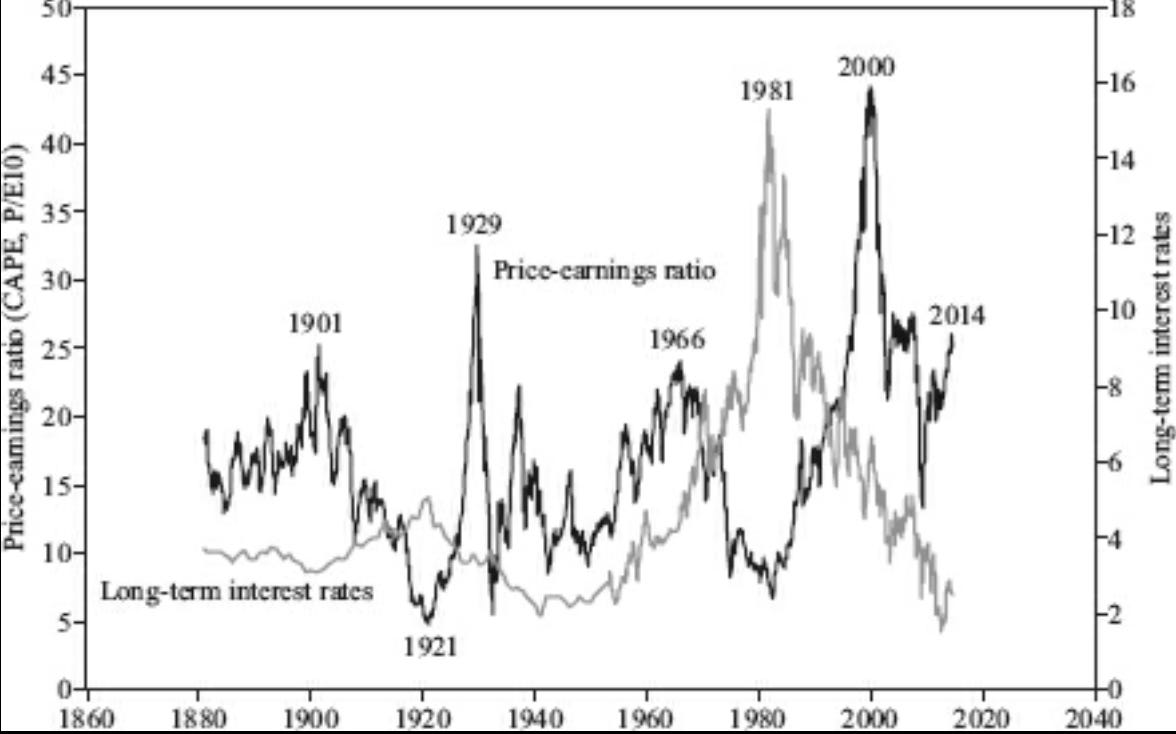
CAPE peaked at 47.2 in March 2000, the highest ever. Previous high CAPE periods include June 1901 (25.2), September 1929 (32.6), and January 1966 (24.1).
Author’s Note: not to be a “new era guy,” but CAPE of S&P has been sustained high for a long time now (2024).
Real S&P Stock Price vs S&P Earnings (1870 - 2014)
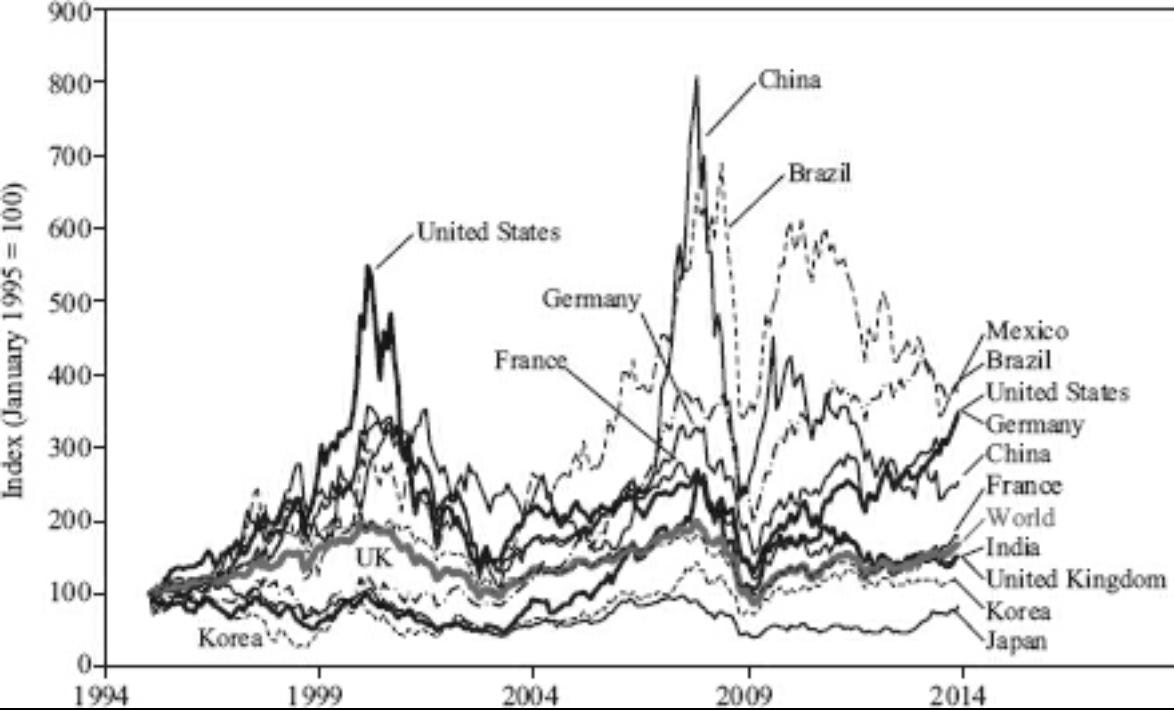
Real Stock Prices in Ten Countries (1995 - 2014)
CAPE Ratio vs. Interest Rates in U.S. (1881 - 2014)
…
BONDS, HISTORICALLY
Fed Model:
Popularized in the late 1990s and early 2000s to justify rising stock prices amid falling interest rates.
Evidence for the model is weak; during the Great Depression, low interest rates did not correlate with high stock market valuations.
After the 2000 market peak, both price-earnings ratios and interest rates declined, contradicting the model's predictions.
Criticism of CAPE Ratio
Bill Gross of PIMCO highlighted that discussions of CAPE often neglect the impact of low interest rates post-crisis (e.g. 1.43% 10-year yield in July 2012.)
Instead, his "new normal" or “new neutral” view suggests lower likelihood of a bond market collapse, though overpricing concerns persist.
Shiller thinks he underestimates the probability of a bond collapse (due to increase in inflation and withdrawal of quant easing), but admits overpricing should be compared with other markets.
Inflation and Interest Rates
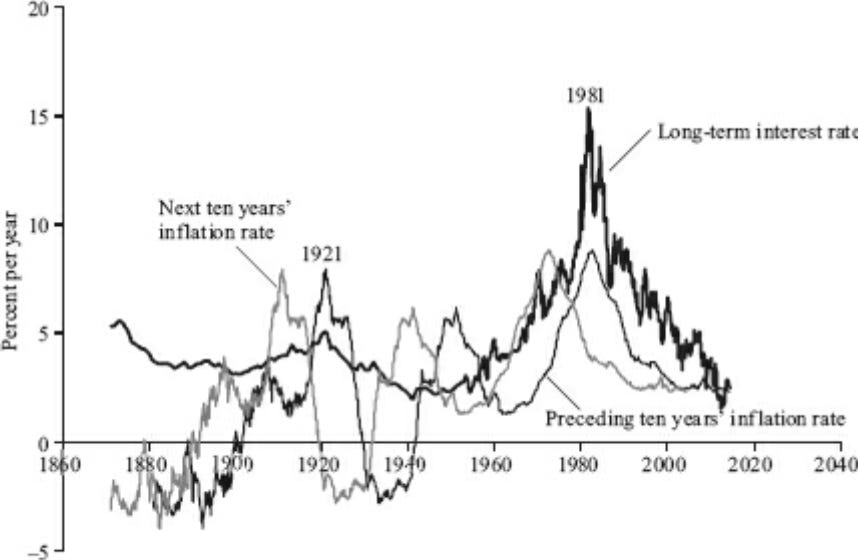
Historically, there is practically no relation between long-term interest rates and future long-term inflation—the type that matters.
U.S. Long-term Inflation vs. Interest Rates (1871 - 2014)
Real Interest Rates
Introduced by John Bates Clark in 1895, defining real as nominal less inflation
The term "real interest rate" wasn't common until after 1960, suggesting a slow adoption of Clark’s concept.
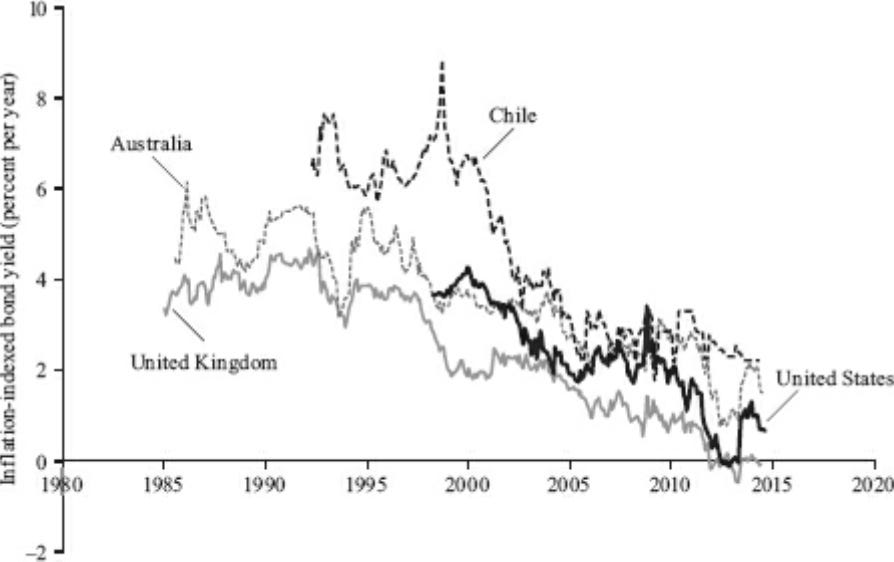
Inflation-indexed bonds, which show real rates, didn't exist in major countries until the 1980s.
Theorists argue stock market ratios should relate to expected real rates, not nominal, assuming investors understand real vs. nominal rates.
Show a long-term decline in real interest rates, reaching low levels by 2012.
U.S. and U.K. real bond yields turned negative in 2012, indicating investors accepted guaranteed negative real returns.
Inflation-Indexed Bond Yields for Four Countries (1985 - 2014)
Implications for the Equities:
Negative real bond yields suggest higher stock market valuations.
Financial theorists like John Campbell and Luis Viceira emphasize long-term indexed bond yields as the true riskless rate.
Investor Misunderstandings:
Many investors overlook the importance of indexed bond yields and misunderstand inflation protection.
Inflation indexation, contrary to some beliefs, protects against price-level risks without introducing new risks.
…
REAL ESTATE, HISTORICALLY
Unfinished — largely academic book that isn’t very applicable. Don’t see a value in writing more other to satiate my compulsion to finish before proceeding.